If you’re a performance marketer reading this, I urge you to do this:
Connect Claude Code to your ad platform API. And just play.
I’ve been in performance marketing since 2006. Managing clients, building in-house performance teams. After I installed Claude Code and connected it to Google Ads API — my jaw dropped.
In February, after 3 weeks I built five tools with Claude Code. They fundamentally changed how I work with clients. Tools I use daily, on real accounts, with real budgets.
Here’s each one — what it does, how I built it, and what went wrong.
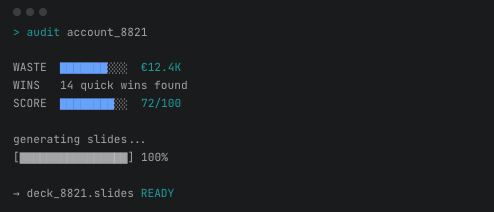
1. Google Ads audit for a new client
The situation: I had a new e-commerce client. After our initial call, we agreed on an audit deal. I would take a look at the ad account and write down what could be done to increase campaign efficiency. So I needed a full account audit — performance overview, revenue breakdown, market comparison, seasonality patterns. The kind of analysis that normally means half a day in the Google Ads interface, clicking through reports, exporting CSVs, building pivot tables.
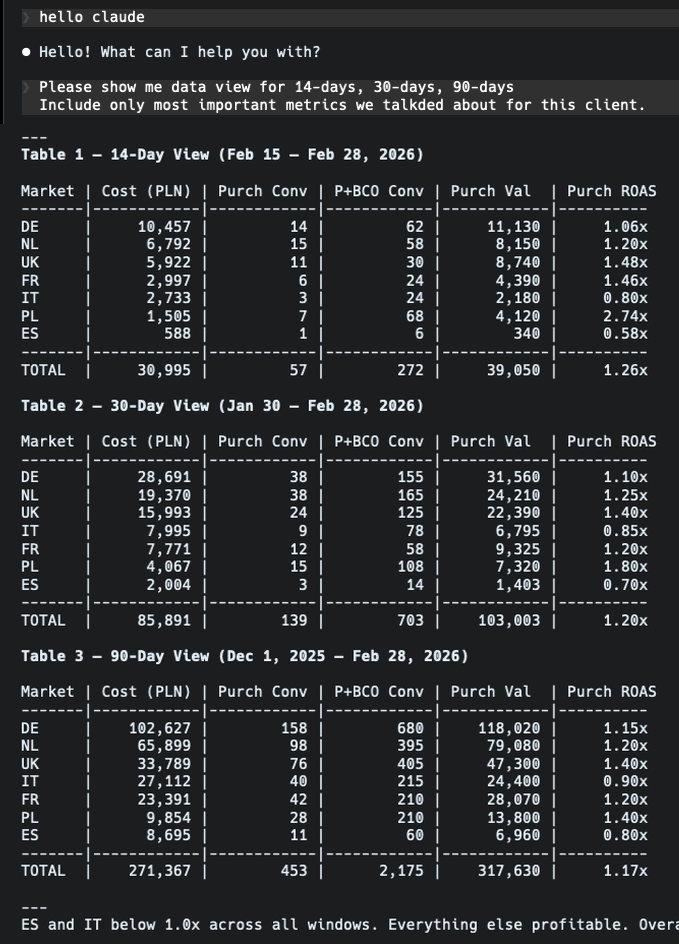
What I did: Connected Claude Code to the Google Ads API and told it to pull the last year of data. What surprised me immediately was how easy it was to extract revenue data — even though the account had dozens of different conversion actions with different values. Normally I’d spend a significant chunk of time just figuring out which conversions and conversion values to sum and setting up a good pivot table. Claude mapped them all, pulled the numbers, and when I checked the control totals against the Google Ads dashboard — everything matched. To get different views of 14-day, 30-day, 90-day or even a full year window, I just had to ask.
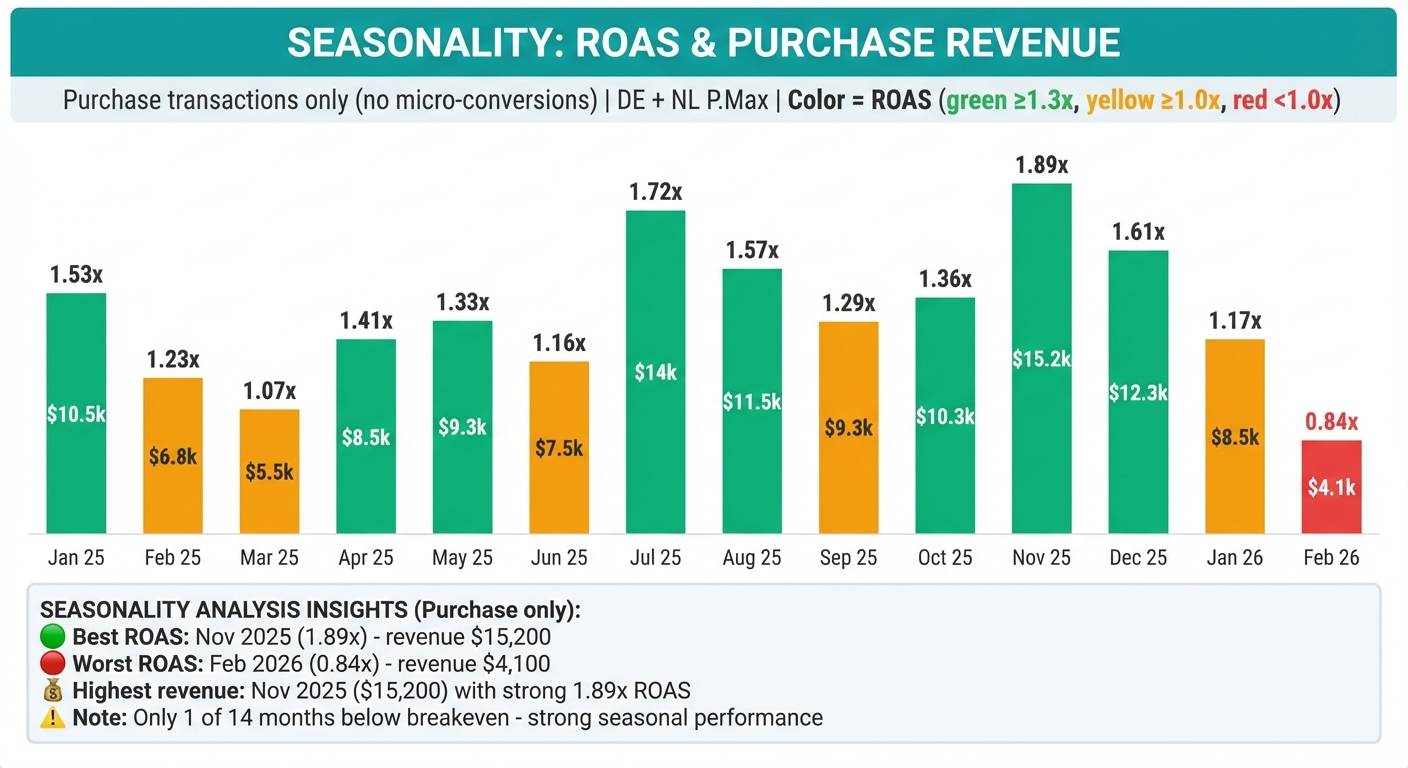
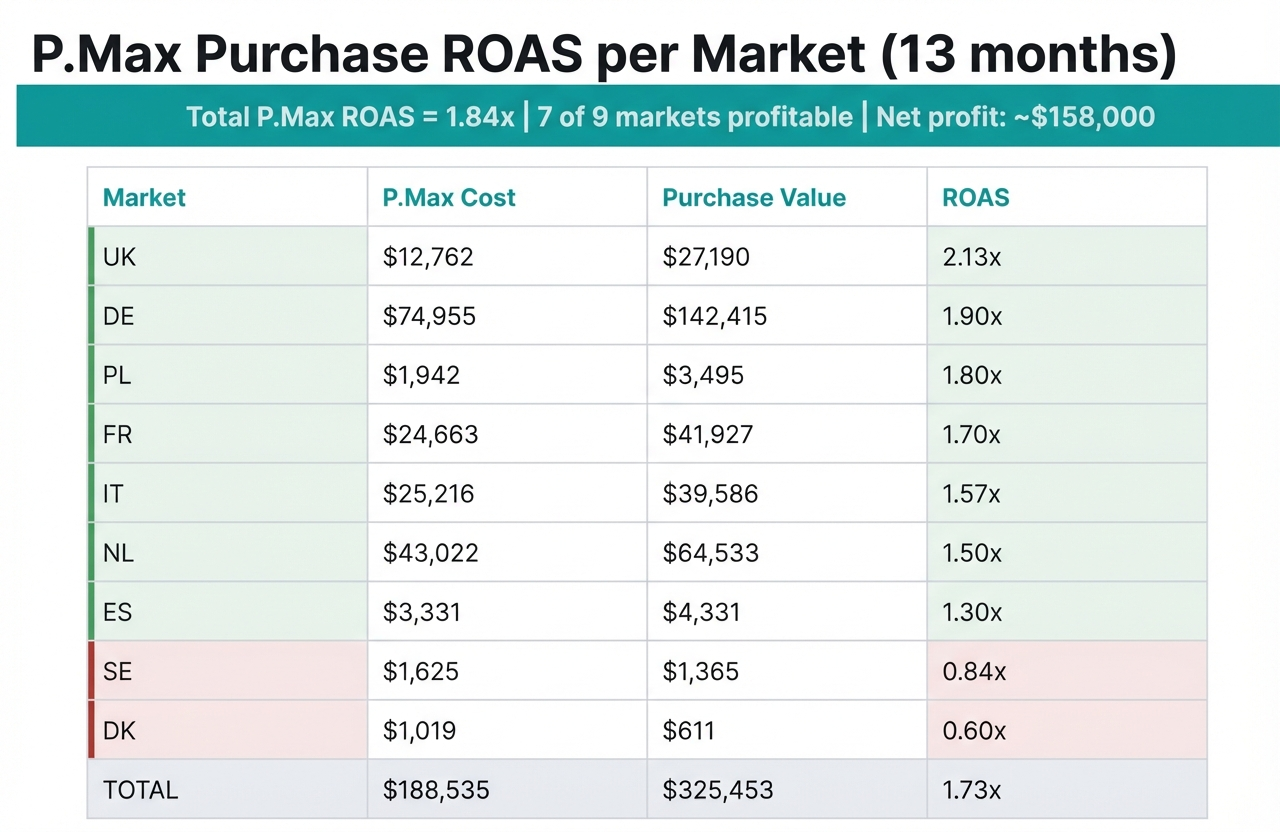
The seasonality and market breakdown: This is where it got genuinely impressive. I asked for ROAS per country. The thing is, campaigns come and go throughout the year — some markets had 15+ campaigns that were created, paused, replaced. Manually, I’d need to aggregate all campaigns per market across the entire year, which is tedious and error-prone. Claude did it instantly. Immediately showed which markets were above average ROAS (worth scaling) and which were below (worth optimizing). After that, the seasonality analysis was straightforward — clear patterns that would have taken me a while to visualize.
The presentation: I generated a Google Slides deck with the findings. I won’t lie — I had to prompt it quite a bit to get the slides looking decent. Programmatic Google Slides formatting is painful regardless of the tool. But after some back and forth, I had a presentation I could walk through on the client call.
Time saved: What would have been a full day of work became about 2-3 hours, most of which was me reviewing the output and refining the presentation. Not to mention the energy saved — I could focus on strategy instead of wrestling with reports and data splits.
2. Meta Ads audit with statistical guardrails
The problem: Same as above, but for Meta. With an extra complication — the client couldn’t give me the right access level for the Meta Ads API. So I wasn’t able to get the data right away. We were in a hurry to get the audit, so I needed Claude Code to control the browser.
What I built: A system that combines Chrome DevTools automation (via MCP protocol) with Meta’s Graph API that got me user-level access — problem solved. Then it extracted campaign data, creative performance, audience insights, and generated an HTML report (I wanted to test a different approach to Google Slides).
The mistake that made it better: Claude analyzed carousel ads and confidently declared certain creatives as “top performers.” The analysis looked solid — the data was correct, the conclusions were dead wrong.
Then I checked the numbers. Some “top performers” had a sample size of one conversion. Claude had calculated percentages and drawn conclusions from statistically meaningless data.
We talked about statistical significance and campaign data analysis. I built guardrails. The system now checks sample sizes before making performance claims. Low-sample segments get flagged, not analyzed. I documented this in a lessons-learned file that Claude reads before every analysis.
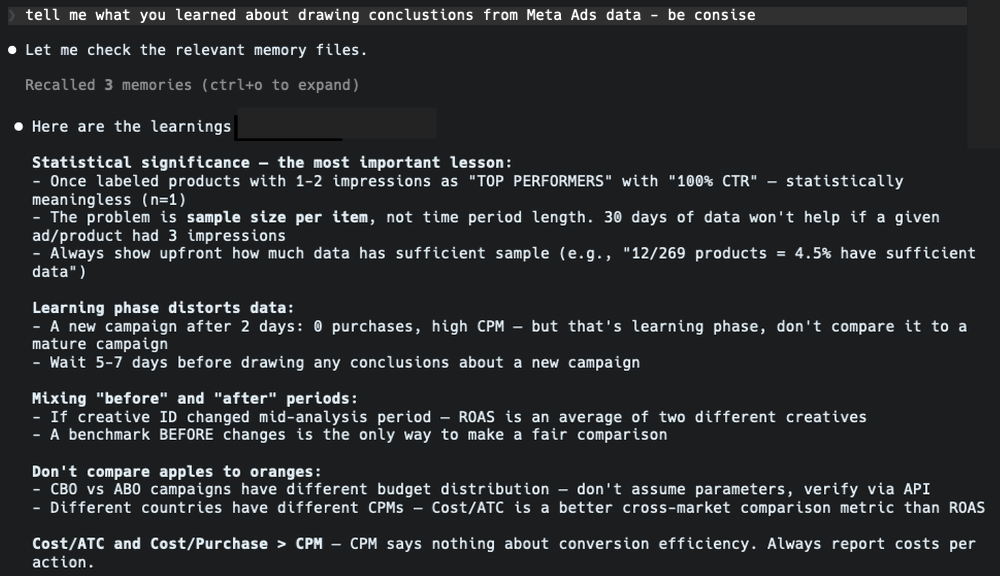
The takeaway: This is probably the most important thing to keep remembering: Claude Code is extraordinarily capable, but it doesn’t know what it doesn’t know. If you don’t understand statistical significance, you won’t catch it when Claude doesn’t check for it. Your domain expertise isn’t optional — you work in tandem with AI and develop solutions that you can reuse in future projects.
3. Campaign management CLI with safety rules
The problem: Sometimes I need to make bulk changes across campaigns — add sitelinks, change ad texts, change bid strategies, pause underperformers, to name a few. The Google Ads web panel is better than Meta Ads, but it’s still a slow and boring process. You might think Google Ads Editor is the answer, but it’s still manual. Let’s do it like it’s 2026.
What I built: A command-line tool that connects to the Google Ads API and can create, modify, and monitor campaigns directly from the terminal.
Why it scared me: This tool makes real changes to real campaigns with real client budgets. So I built safety rules:
-
CRITICAL (changes to campaigns that are key performers): a set of rules for campaigns that are top performers, top spenders. Changes to these campaigns require explicit confirmation + reason. The app asks if I’m sure about the changes and gives me context of data.
-
HIGH (bid strategy changes): requires confirmation and gives context if, for example, tROAS is being decreased by more than 20% or if there were recent changes.
-
MEDIUM (ads, ad group modifications): logged with warning and a check if there are active items for the ad group or asset group to continue to work.
The tool also tracks spend thresholds and won’t let you accidentally multiply a budget by 10. It validates conversion tracking names before applying target ROAS strategies. Here’s a snippet of my safety protocols in this app:
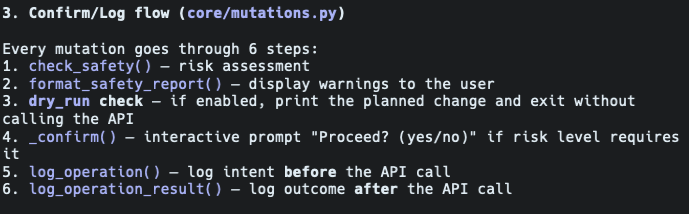
What surprised me: Building safety rules was the easy part. Claude understood the concept immediately and implemented risk classification. The hard part was defining what should be critical vs. high vs. medium — that’s pure domain knowledge that I had to specify explicitly.
The takeaway: Treat AI like a junior or a trainee. Ask questions that you already know the answer to. Predict typical rookie mistakes just like you would with a human. Build learnings on them.
4. Multi-client data analysis platform
The problem: I manage campaigns across multiple clients and markets. One client alone sells in 6 European countries. Weekly analysis means pulling data for each market, comparing trends, identifying gaps, generating reports. Half a day, every week.
What I built: A structured analysis system with per-client workspaces. Each client has dedicated data fetchers, analysis scripts, and presentation generators. There’s a shared methodology layer — standardized metrics, reporting conventions, A/B testing frameworks — so analysis is consistent across clients.
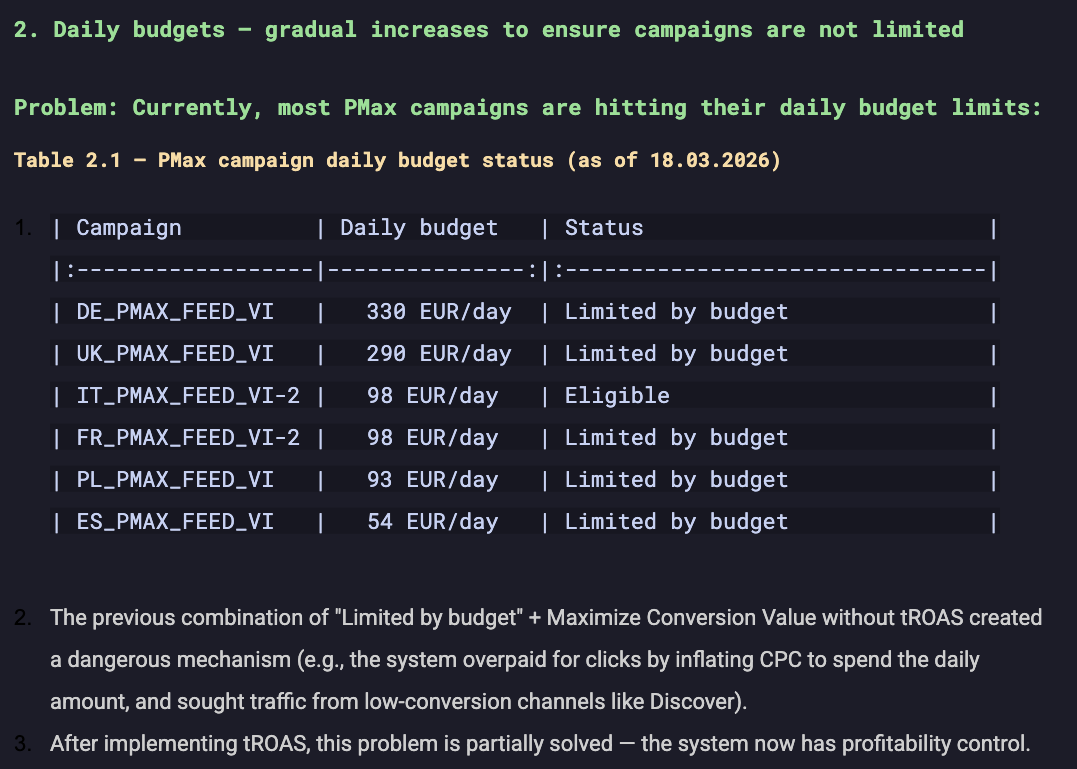
How it works in practice: I run a script before my morning coffee. It pulls fresh data for all markets, runs comparative analysis, flags anomalies, and generates a report I can review in 15 minutes. If something needs attention, I drill down. Again — trust but verify on your own.
The real value: It’s not the time saved on any single report. It’s that I can now monitor more clients at a higher frequency. The system scales in a way that manual work never could.
5. Client offer generator (7 iterations)
The problem: Sending professional offer presentations to potential clients. Three packages, pricing, scope descriptions, nicely formatted in Google Slides. If every client feels like a custom project, you don’t have a company — you have a job.
What I built: A Python script that generates offer presentations programmatically in a template with my BAUER_ brand visuals.
Why I’m including this one: Because it took 7 iterations to get right. And that’s the honest story of working with Claude Code. It’s sometimes frustrating.
Version 1 produced really ugly slides. Version 2 had text overflowing the boxes. Version 3 had layout issues with the pricing table. Versions 4–6 were incremental fixes where solving one problem created another. Version 7 finally worked.
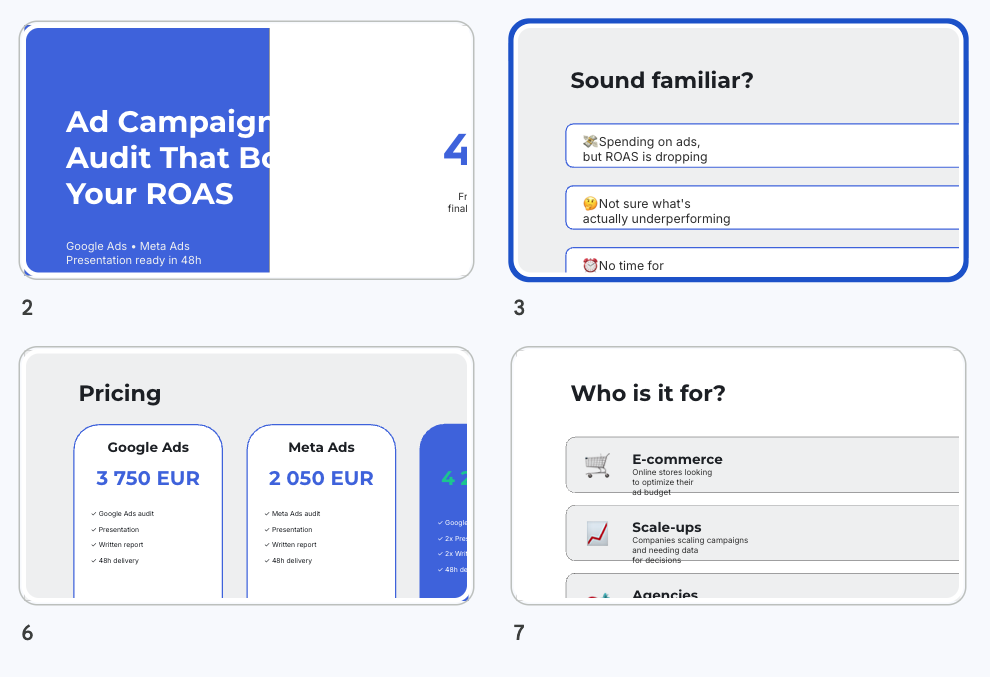
This isn’t a failure story — it’s a process story. Every iteration took 10–15 minutes. Most of the time I spent on defining what I want. The better the project specification, the better the outcome. The whole thing was done in an afternoon. It wasn’t perfect — it was good enough. And now when I have a client with special requests or a custom approach, I add or remove a service, change pricing, and add what the client cares about. I edit one data structure and regenerate in seconds.
The point: If someone tells you Claude Code produces perfect results on the first try, they’re either lying or doing something very simple. Real projects require iteration. The difference is that iteration with Claude Code takes minutes, not days.
What doesn’t work
To be fair:
-
Confident mistakes are the biggest risk. The Meta statistical significance issue could have embarrassed me in front of a client. AI won’t think for you — you have to work in tandem.
-
Use your domain knowledge — I cannot stress this enough. Don’t accept mediocrity. You know your domain better than AI — use that experience and your way of working.
-
Google Slides formatting is painful. After many tries I’ve set up a good template for my documents. Programmatic Slides generation can be a pain. I would, in your case, use Gemini models — because it’s a Google ecosystem. I decided to work with Claude.
-
Token limits are real. On the Pro plan I hit limits regularly. Upgrading to Max helped, but marathon sessions can still exhaust it.
-
Context window has limits. On complex projects, Claude sometimes forgets decisions from earlier in the session. You learn to work with this — CLAUDE.md files, clear instructions, reference documents.
Where to start
If you’re a performance marketer reading this, don’t start with a big project. Do this:
Connect Claude Code to your ad platform API. And just play.
Ask questions about your own data. “Show me campaigns where CPC increased more than 20% week over week.” “Find ad groups with impressions but zero conversions.” “Compare brand vs. non-brand ROAS over 6 months.”
This is where the ideas come from. When your own data responds to natural language queries, you’ll start thinking: I could automate that report. I could build a monitor for that. I could audit all my clients with one command.
That’s how these 5 tools started. Not with a plan. With curiosity and problems that needed solving.
Running audits, managing campaigns via CLI, and generating reports — all built in 30 days. The code isn’t always pretty. The results are.